© ESA/ATG medialab
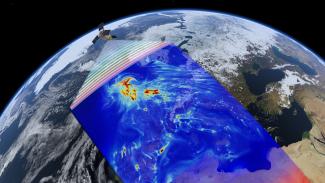
ESA’s Sentinel 5P satellite circles the Earth and collects air quality data
On average, we take 20,000 breaths a day, each time effortlessly inhaling air that while not visible is actually full of ‘ingredients’, just as a cake might have. In the case of air, the ingredients are almost entirely gases. But like an egg in a cake recipe, ingredients that make up air are also affected by environmental factors around them.
Environmental monitoring: from fixed to mobile sensors
Human activities such as driving to work, producing goods or heating our homes release pollutants that are harmful to our health and can cause respiratory diseases including asthma. Therefore, pollutants like NO2 (Nitrogen Dioxide) and others are monitored through eight fixed sensors around Luxembourg. Acting like detectives, they closely measure and tell us the air’s ingredients and their concentrations. However, as technologies and computing powers have greatly advanced and devices have become smarter and connected to the internet, one might ask how could we improve environmental monitoring and what new information could we learn?
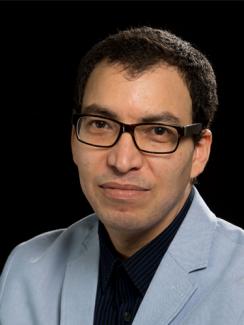
Asking these questions is Dr. Hichem Omrani, a researcher at the Luxembourg Institute of Socio Economic Research (LISER). He is rethinking the way measurements are taken in Luxembourg in the hope to establish more accurate metrics. Dr. Omrani understood that by creating a new class of mobile sensors we could overcome the key limitation of fixed sensors where environmental data, especially when people are mobile, are scarce in Luxembourg and elsewhere. However, these mobile sensors needed a way to be deployed. The proposed solution is to ‘piggy-back’ on emission-free buses which travel around the Grand Duchy and will provide real-time and very fine spatial (location) data. Furthermore, when combined with data from the Sentinel 5P satellite orbiting the earth 817 kilometers above us, an unprecedented picture of air quality of the Grand Duchy will become visible.
The wheels on the bus go round and round – just as a satellite does!
Together, Luxembourg buses on average drive 142,000 kilometers a day, which is around 52 million kilometers a year. In other words, buses in Luxembourg drive roughly three and a half times around the earth each day! Going South to North and East to West, their scheduled daily trips are ideal to use new sensor technology and monitor people’s exposure to harmful pollutants. Unfortunately, this mobile ground monitoring will not cover the entire territory of Luxembourg but our friends at the European Space Agency (ESA) have a solution for this.
While buses in Luxembourg `circle the earth each day’ figuratively, the ESA’s Sentinel 5P satellite circles the earth… literally…in fact, 14 times a day. During one of these orbits, it passes over Luxembourg once a day, beaming down air quality data – roughly a terabyte of per year. The powerful instruments on the satellite give a comprehensive view of pollution in Luxembourg’s atmosphere as well as in that of our neighbours in the Greater Region. The larger coverage can help explain causes and sources of pollution to complete our understanding.
Once data from land and space are combined with weather, traffic, land use and population data, improved air pollution maps are generated (Figure 1). This all-around data-driven modelling provides an assessment of population exposure to the air pollution and creates hotspots/coldspots air pollution maps to highlight clean areas and show polluted ones for possible future mitigation.
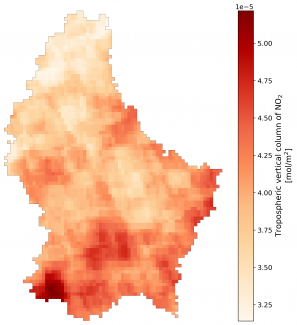
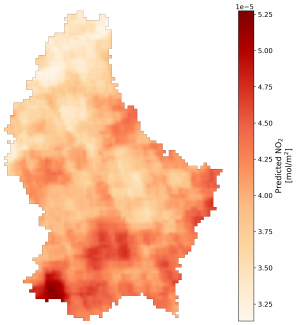
Figure 1: Average of NO2 concentrations in Luxembourg in April 2020 (coarser scale on the left (3x7km2) and refined fine scale on the right (100x100m)). This is a sample of maps generated with the newly developed tool (monitaas: monitoring software as a service), where the user can customise the spatio-temporal resolutions (e.g., 100m and monthly data) and pollutants (e.g., NO2). The darker the red colour, the higher the NO2 concentration measured. Credit: LISER
Translating the data into action
The UN’s Environment Programme estimates that air pollution kills seven million people a year and is the most important environmental health risk of our time. Unmasking the invisible to give pollutants a face will not only provide needed awareness but will help environmental agencies and local communities assess their personal exposure to air pollution. Examples of this include predicting vehicle traffic and forecasting when industrial actors release pollutants. Both of these can inform decision makers to better protect schools, recreational and residential areas and overall vulnerable people (e.g., children, elderly).
Furthermore, better data measurements will give a voice to the underprivileged who might be exposed to pollutants. By pairing air quality figures with socio-economic demographic of residents in communities, we can assess the difference in exposure with the population attributes (e.g., occupation, education, nationality, wealth, gender, etc.). This then helps to identify any ‘environmental inequality’ across different areas and times.
Currently, researchers at LISER are working on another large European project in examining the socio-economic consequences of air pollution. LISER will build on the project’s health impact projections to incorporate new health repercussions in the economic impact assessment. Dr. Omrani aims to work with and build upon this expertise to help reduce respiratory diseases and the suffering linked to them. This would improve the quality of life for many and help society avoid health care costs.
Looking beyond, future works will assess transportation policies (e.g., free public transport, electric vehicles, road pricing, taxation, car-sharing) to mitigate air pollution.
Authors: Hichem Omrani & Nicolas Stamets (LISER)
Editor: Michèle Weber (FNR)
Images: © ESA/ATG medialab and LISER

