Daniele Proverbio, Christophe Ley, Pierre Mangers

(C)Pierre Mangers/Christophe Ley/University of Luxembourg

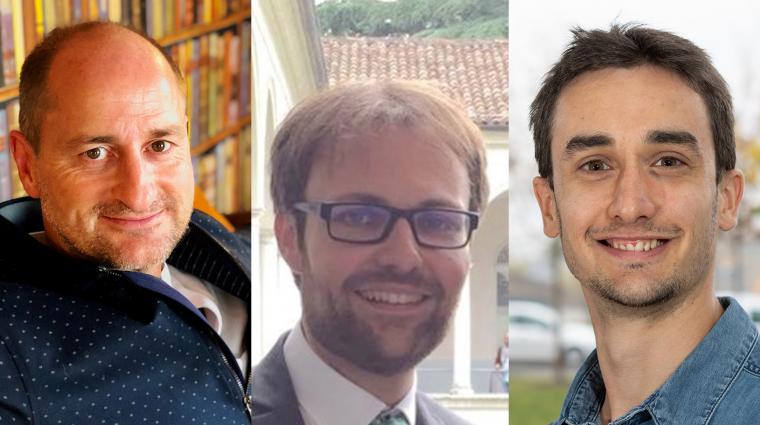
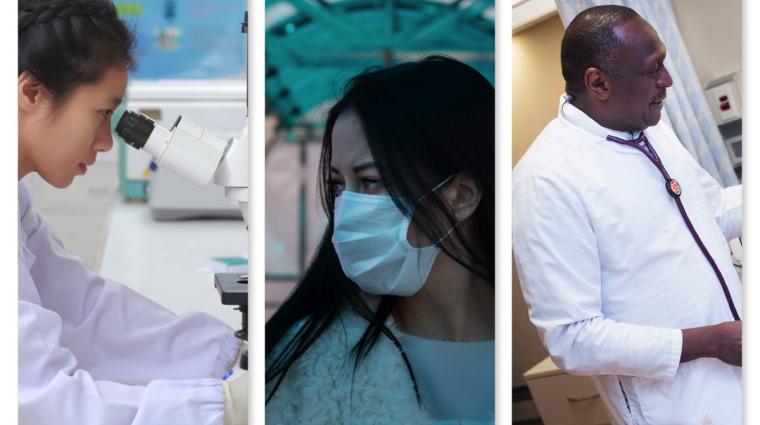
Corona glossary authors: Daniele Proverbio (right), Christophe Ley (middle), Pierre Mangers (left)

Since the new corona virus entered our lives, we are increasingly confronted with technical terms that are otherwise only of importance to experts. All of a sudden, we have to deal with concepts such as reproduction number, virulence or the difference between PCR and antibody tests.

Daniele Proverbio, Christophe Ley and Pierre Mangers went through the trouble of creating an extensive glossary of terms related to the coronavirus pandemic. Daniele Proverbio is a PhD student at the Luxembourg Center for Systems Biomedicine (LCSB) at the University of Luxembourg; Christophe Ley is Professor of Mathematical Statistics at the University of Ghent and Vice President of the Luxembourg Statistics Association; and Pierre Mangers, a qualified chemical engineer and economist, heads his own consulting company MANGHINI Consulting after 20 years of professional experience in management consulting and industry. The three work together in Work Package 6 of the COVID-19 Task Force from Research Luxembourg, which deals with the statistical projections of the pandemic in the country.

For a better overview, we have structured the glossary as a drop-down menu. The terms are arranged alphabetically within the individual chapters. The complete glossary can be downloaded as a PDF at the end of the article.

science.lu would like to point out that the rapidity with which new information about SARS-CoV-2 and COVID-19 is released every day may make some of the information in this document out of date very soon.

Nonetheless, we hope that it provides a useful reference while also giving an insight into the complexity of the topic.

What follows is the text of the scientists:

1. Introduction

Effective communication in science relies on the understanding of specific terminology. This document provides a handy glossary of the words used to describe the Coronavirus disease-2019 (hereafter COVID-19 or pandemic), caused by the SARS-CoV-2 virus, and the work of researchers studying the disease.

The authors would like to underline the importance of scientific research in the current situation. Studying a novel virus requires interdisciplinary collaborations between many scientists in order to decode the nature of the virus, understand the pandemic and its impact on several sectors of our society. Each area of expertise plays a specific role. Universalists (scientists with a broad overview) assess the pandemic globally at the beginning to identify the big picture of the disease and the interwoven subject matter expertises required to get it under control. Specialists intervene to deliver their deep subject matter expertise. It is crucial to rely on both to communicate about different aspects of the pandemic. For this reason, the following glossary is covering a wide diversity of scientific fields, with words that relate to COVID-19 and health-realted topics but also to mathematics, modelling and research in general.

2. Glossary

CORONAVIRUS PANDEMIC

In the broadest sense of the word, an agent is anything that “does” something (from latin “ago”, meaning “I do”). More specifically, biological or infectious agents are micro-organisms or viruses, and human parasites, which may provoke an infection, an allergy or may be toxic.

A person who has contracted the virus but does not feel nor exhibit any symptom (objective or subjective signs). Those who feel mild symptoms (e.g. low-grade fever, cough) are not asymptomatic but symptomatic (although not severe). It is generally believed that asymptomatic persons are contagious and can consequently contribute to the quick spread of the disease.

The state of being able to transmit a disease to another person, directly or indirectly, after being infected. Same as “infectious”. Contagiousness and virulence are used to classify pathogens.

Finding people who came in contact with an infected person and letting them know they may have been exposed to the virus. It can be performed manually through questionnaires or automatically, with more or less invasive technologies like Bluetooth, to record proximity events of smartphones. It is believed to be a major asset to control the spread of the disease. In many countries, the authorities are currently debating what could be the best trade-off between preservation of privacy and benefits in hampering the epidemic.

Slightly different is “proximity tracing”, a proposed automatic protocol to count not close contacts (people with whom a person had social interaction like a chat), but people who just got physically close to an infected person while moving.

Coronaviruses are a group of RNA-based viruses that affect mammals and birds.They owe their name to the spiky protrusions of the viral surface that resemble a corona (from Latin for crown) when observed under an electron microscope. There are many types of coronaviruses. Some are only found in animals (for now, at least) and others cause the common cold in humans. The SARS 2002-2003 epidemic was caused by another coronavirus (SARS-CoV-1).

The name of the disease caused by the novel coronavirus, SARS-CoV-2. It is short for “Coronavirus Disease 2019”.

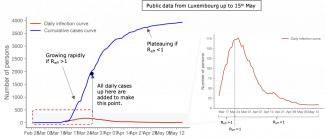
Each day, new infections (positive cases or (PCR-)tests) are registered. These new infections can be presented graphically in different ways. The curve of daily cases connects the number of new cases over time. If the number of new infections remains constant, the curve takes a more or less flat course. If the number of new infections goes down, so does the curve. On the other hand, the cumulative curve adds up all cases that happened so far, reporting the total of confirmed cases. If the number of new infections goes down (and hence the daily infection curve goes down), this curve flattens. This is also what the goal “flatten the curve” refers to [see page 6]. The cumulative cases curve can never go down, because there are no negative values for new infections.

In uncontrolled epidemics, the daily cases curve grows. Then, if pharmaceutical (e.g. vaccines) or non-pharmaceutical interventions (e.g. social distancing) are taken or herd immunity is reached, the curve of daily infections could peak and decrease (controlled epidemic). A daily infection curve converging to zero means that the epidemic is close to be eradicated, if the same measures are held.

The curve can grow and decline faster or slower, depending on virus transmission rate and strength of suppressive interventions (as reflected by the curve in different countries).

Chemicals that kill viruses and other microbes, intended for use on inanimate objects (like surfaces, doorknobs, etc.). They can be toxic, and should not be ingested or inhaled. Other disinfectants are destined to clean skin and wounds. They should not be ingested or inhaled either.

Case fatality rate (CFR): the total number of registered deaths caused by a specific disease, divided by the total number of positive cases detected by (PCR-)testing. It therefore indicates the likelihood of an infected person to die from the infection. It In fast-moving situations like COVID-19, it overestimates the risk of death for an infected person.

The CFR is not constant but changes with the context and the timepoint of the calculation, especially during the beginning of the outbreak. In fact, it differs by location, by age groups and with associated comorbidities. It is used to quantify the severity of the epidemic.

By current estimations, COVID-19 CFR (between 0.5% and 15%) is lower than MERS’ (34%), but higher than that of a seasonal flu (around 0.1%). Several scientists also use the term “virulence” as a synonym of case fatality rate.
 

Infection fatality rate (IFR): the total number of deaths, divided by the total number of infections for a specific disease (including those not reported or detected by testing).

Both numbers are hard to estimate due to practical reasons. For example, it is not always clear whether a person died because of Covid-19 or because of comorbidities, and the number of confirmed cases depend on testing capacities. Therefore the true COVID-19 IFR is still unkown, the true COVID-19 IFR is still unknown. If correctly estimated, it would assess the individual risk of dying from COVID-19.
 

Mortality Excess: due to the uncertainty of the IFR, scientists and statisticians prefer to calculate the Mortality Excess. It represents the difference between the total death rate (due to any reason, equalling all people admitted to cemeteries) per month on a year-to-year comparison, often for each age group. In Luxembourg for instance, there has been an excess-mortality of 15,3% for the second half of March 2020, according to STATEC.

Slowing the spread of the virus in order to reduce the peak number of daily cases and related pressure on hospitals and infrastructure. A lockdown is hence described as a “hammer” to knock down the curve. Non-pharmaceutical interventions such as social distancing supported by school closures, limited contacts and face masks help to reduce the incidence rate [see below] of the disease.

A certificate indicating that a person has had the disease, has been tested with an antibody test and developed immunity. However, there are scientific problems related to test statistics and and it is currently still not known whether previously infected individuals are immune to SARS-CoV-2 and for how long. There are also legal and ethical issues that are currently being debated.

The incidence rate is a measure of the frequency with which some event, such as a disease or an accident, occurs over a specified time period. Incidence rate or “incidence” is numerically defined as the number of new cases of a disease within a time period, as a proportion of the number of people at risk for the disease.

For a viral infection, it takes some time from exposure to the development of symptoms. For COVID-19, the incubation period ranges from 2 to 14 days, with a median of 5.2 days. A person can be infectious during part of the incubation period. For COVID-19, many people also don’t develop symptoms, but nevertheless become infectious after the incubation period.

Separating sick people with a contagious disease from those who are not sick (same as quarantine).

There are different types of face masks, with different purposes and different efficacy.

N95 (disposable respirator): personal protective equipment that protects the wearer from droplets and airborne infectious agents. They have different standards (in Europe Filtering Face Piece, FFP1, FFP2, FFP3) for increasing filtering capacity.

They also prevent contamination of surrounding surfaces, by holding the wearer’s fluids back. FFP2 and FFP3 are recommended against COVID-19.

Surgical mask: disposable medical device that protects against infectious agents transmitted by droplets, but not against airborne infectious agents. They prevent contamination of surrounding surfaces, by holding the wearer’s fluids back. People wearing masks appropriately (see the government guidelines) mainly protect others from infection, but if most people wear masks, it helps to protect the entire population as transmission of the virus is reduced. Surgical masks were distributed by the Luxembourg government.

Barrier masks: their requirements are less ambitious than the ones above. They are meant to prevent contamination of surrounding surfaces, thus protecting others from the wearer’s emissions. Different tissues have different filtering capacities.

Small changes in an organism’s genetic code. They naturally happen daily in all organisms, and most have little tangible effect.

Viruses can mutate into new strains that our immune system does not recognise and can thus become dangerous for us. Minor mutations might change the parts of a virus we are immune to, rendering our immunity less effective or even useless. This is why the flu vaccine needs to be repeated yearly. This is also something that has already been observed for SARS-CoV-2, and could be one reason why not everybody is immune after having been exposed to the virus. Sequencing the genome of the virus enables virologists to reconstruct the history of the mutations of the virus.

Since mutations happen by chance, the more often a virus reproduces inside a host, the more likely it is a dangerous mutation will occur. So, hampering the spread of the disease, thus lowering the number of infected hosts, also helps reducing the probability of a dangerous mutation. On the other hand, a virus can also mutate and become less dangerous.

Greater variance in a set of observations than would be expected on the assumption of normal distribution. Statistically, it measures superspreading events in a population.

Keeping a sick person away from other people (like isolation). “Quarantine” is a more formal word, that is sometimes used by public authorities. The usual quarantine period in most European countries is 14 days, to account for the average contagious period.

These are all indicators used to quantify the evolution of an epidemic in a short and concise way. In addition, they allow comparison of the epidemic progression between countries in a more quantitative way than just looking at the slope of infection curves. All “R”s are closely related with each other.

R0: the “basic reproduction number”, signifying the average number of cases each infected person will cause if no action is taken and the whole population is susceptible. “0” refers to “time zero”, at the beginning of the epidemic. It has a fixed range that is disease-specific and allows comparison of virulence and contagiousness. For SARS-CoV-2, it is estimated between 2.2 and 4.2, higher than the flu-causing Influenza (R0 between 0.9 and 2.1), close to SARS (R0 between 2 and 3.5), but lower than measles (R0 between 12 and 18).

R_t: as the epidemic evolves and measures are taken, the “reproduction number” might vary in time. So, from the very first value R0, the index evolves in time, tracking the infectious curve. In this regard, R0 is an upper value for R_t. Social distancing and other non-pharmaceutical interventions have proven effective in lowering R_t. However, lifting measures might trigger the opposite effect.

R_eff: the “effective reproduction number”, signifying the average number of cases each infected person will cause during the epidemic. It evolves in the same way as R_t. The sole difference between the two is that R_eff is scaled according to the true number of susceptible people, while R_t assumes that 100% of the population is susceptible. For instance, a person who is self-isolated in a far-away place cannot really be considered susceptible. Similarly, a vaccine or growing natural immunity in the population would reduce the number of susceptible persons. At the beginning of the pandemic, R_t = R_eff.

Methodologically, R_t is usually estimated from principle-based models as the ratio between illness and recovery rate, while R_eff comes from data-driven models . Intuitively, R_eff is proportional to new cases of today divided by new cases of about 4 days ago (4 days being the serial interval [see below] of COVID-19).

R_eff is used as an epidemic “thermometer”: with R_eff<1 the curve of daily infections is decreasing, with R_eff=1 remains stable, with R_eff>1 the curve is growing, the faster the larger R_eff is. For risk analysis, R_eff is used together with other indicators.

R: short-hand notation for R_t and R_eff. Often used by the press.

The name of the novel coronavirus that causes COVID-19 disease: severe acute respiratory syndrome coronavirus 2.

The average period between two transmissions in a chain of infections (person A infects person B, who then infects person C). For COVID-19, it is estimated around 4 days.

When certain individuals infect unusually large numbers of secondary cases. They could happen during mass events like concerts or religious cerimonies. Superspreading is measured by overdispersion.

The safety precaution of staying at least 1-2 meters away from each other and avoiding large gatherings. It is also called - perhaps more appropriately - “physical distancing”. It is meant to hamper the disease spreading and to flatten the curve.

SCIENTIFIC RESEARCH

Tests on humans to see if a drug, a therapy or a vaccine works. They proceed in highly controlled stepwise phases from very small to large groups to determine both effectiveness and safety. They correspond to controlled experiments.

A collection of basic entities, interconnected in a non-trivial fashion, is a complex system. Complex systems are more than just the sum of their parts. Complex systems are particularly hard to study and understand, because they cannot be reduced to parts being studied independently. For instance, individual gears from a disassembled watch do not tell anything about the behaviour of the complete watch itself.

Some objects are relatively simple to study. For example, the trajectory of a bullet can be easily predicted as all the variables involved – such as velocity and gravity - are well known.

On the contrary, the weather, biological organisms, societies and epidemics are complex systems; for them, predictions are hard to obtain with accuracy.

For complex systems, predictions are subject to high uncertainties. To reach consensus, researchers build independent models, considering different aspects of a complex system. If they all agree, a higher degree of confidence is obtained, meaning a statement or conclusion is more likely to be true. If some disagree, peer review process begins to assess problems and to further increase the knowledge of the phenomenon.

Statements and interpretations from research outputs have different degrees of confidence: they could be hypothetical, commonly believed or certain (up to current evidence).

From observational studies, researchers make hypothesis (tentative, to be confirmed, low confidence). If these hypotheses are proven correct after controlled experiments, a statement is considered valid, as long as it is not falsified by other experiments.

However, in complex systems [see above], clean controlled experiments are difficult, and statistical methods are applied with their uncertainties. So, a conclusion can be “probable”, “highly probable” or “to be discussed”.

When looking for causes of an observed outcome, the process is sometimes similar to law trials, where a “culprit” is found guilty until proven otherwise. So, consensus among experts is required to assess the confidence of something to be the cause of a phenomenon. This consensus might change in time after new evidence is discovered.

Range of values around a most probable estimation, that quantify its uncertainty.

Example: the incubation period for COVID-19 is estimated to lie between 2 to 14 days at 90% confidence, with median 5.2. This means that half of the measured cases were reported with 5.2 days incubation or less, half with greater values, and that 90% of the cases will range exactly between 2 and 14 days. A small percentage will go out of these bounds: for example one or two people will have an incubation time of more than 20 days.

Nota bene: 90% is an arbitrary choice, which can be conventionally modified to 50% or 95%. Then, the length of the interval would change, with analogous interpretation.

An experiment in which all factors are held constant except for one variable. This factor to be tested is typically contrasted against control groups where all the other variables are unchanged. This way, a hypothesis can be tested. Controlled experiments are different from observational studies.

Causality: when something provokes something else. Pins fall because they are hit by bowling balls. Flu is caused by a virus.

Correlation: when two phenomena evolve in a similar manner over time, but one is not necessarily the cause of the other. Often, correlations are first hints to look for causality, but do not imply it. There is often a common cause behind the two phenomena. Here is an example of correlation: men with hair loss pay more taxes. In this case, there is no causality but a common cause. Professional career progresses with age. The more income, the more taxes and the older, the higher the probability of hair loss. There are many examples of spurious correlations and the scientific method is an effective way to prove them right or wrong.

Scientific discipline studying the distribution (who, when, and where), patterns and determinants (causes and factors) of health and disease in defined populations. It also informs about how a disease might be controlled, and how it may affect society in terms of health consequences and socio-economic costs. Closely related disciplines are virology (focusing on biological aspects of viruses) and mathematical epidemiology (to understand patterns and evolution of an epidemic, with mathematical models).

A person who is very knowledgeable about or skilful in a particular area. In case of a pandemic, experts in viral biology often collaborate with experts in disease spreading, which is related to mathematics. Multidisciplinary collaboration is needed as theoreticians seldom hold deep knowledge on antibodies, and biologists are often not trained to follow trends and quantitative patterns in models and data.

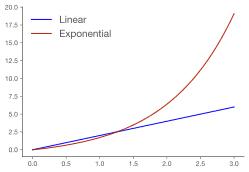
Linear trends are intuitive: the outcome of tomorrow is directly proportional to the outcome of today. Example: if each day I meet a person, by tomorrow I will have met two people, and by one week I will have met 7 people.

Exponential growths are different: they remain silent when the number of cases is low, and then increase rapidly and massively. Example: if each day I infect two people, and they also infect two people and so on, by one week there will be 2 power of 7 = 128 infected people. This is typical of transmission on networks. For this reason, exponential growths are extremely dangerous when relating to a disease and should be handled by models rather than intuition.

In general, a model is an idealised representation of a certain situation according to the purpose of the modeller who selects the features to consider. For example, wind tunnels used for car and airplane design are models created to study the effect of the wind. They allow researchers to replicate in a controlled setting what happens when an object moves through the air. Science massively relies on models to inquire specific questions. There are animal models, in vitro models, industrial models and mathematical models.

Mathematical models are abstract representations, written in mathematical terms. Their elements are put in correspondence with the components of real-world phenomena. Once such a correspondence is declared as plausible, one says that the mathematical model describes the given phenomenon.

Mathematics is a formal discipline, whose results can be derived by following universal logical rules. As a consequence, mathematical deductions can be proved and checked to be true or false, whereas other models have lower degrees of confidence. Despite their abstract nature, even mathematical models are built with certain limitations. The bulk of initial decisions, context, features and simplifications form the model’s assumptions. No model reproduces 100% of reality. Trying to include every possible real-world effect could make for the most complete description, but one whose mathematical complexity would be intractable. Likewise, over-simplified systems may become mathematically trivial and will not provide accurate descriptions of the original phenomenon. In this spirit, Einstein supposedly wrote: “Everything should be made as simple as possible, but not simpler”.

Models are extremely useful to formulate hypotheses and make predictions for knowledge discovery. Studying the properties of a model is likely to shed light on our understanding of the initial phenomenon, to answer certain questions and to inquire important mechanisms.

There are two big classes of mathematical models:

  • Those based on first principles, where the core mechanisms are known, the evolution can be controlled and few input data are measured with precision. This is the case for physical systems like movement of objects, thermal engines, electrical devices.
  • Data-driven models. Based massively on statistics, they capture trends in data and attempt short-term predictions by extrapolation.

In addition to helping knowledge discovery, mathematical models have two practical values:

  • Make predictions: answer the question “what will happen?”

Controlled contexts are predictable for short- and long-term periods. On the contrary, complex systems can be predicted with low uncertainties only in the short-term. In this case, the degree of confidence drops quite soon, as for weather forecasts. For a complex object like an epidemic, predictions can usually be made up to 2-3 days, with an increasing level of uncertainty as the time horizon expands.

  • Inquire scenarios: answer the question “what would happen if...?”

Principle-based mathematical models allow precise control over all variables. It is thus possible to explore plausible outcomes by tuning variables appropriately. This way, one can assess the likelihood of a scenario to happen, if the assumptions are met, for the mid- and long-term. Rather than predictions, those are projections with a corresponding degree of confidence. Principle-based models for epidemics exist and help making plausible projections for assessing the consequences of the measures that authorities want to implement.

A network is a way to model groups composed of many entities that are linked. Such links can be established after communication, physical contacts, or anything that connects two individuals. “Individuals” could refer to molecules, electrons, particles, animals, people, company stocks, or network messages. This universal character makes the beauty of the network definition.

Epidemics are typical phenomena that propagate on networks. The first individual connects to others via contact and/or droplets/aerosols, and the virus propagates. If more than one individual gets infected at a time, the propagation is exponential.

There are several ways to stop the propagation: curing or quarantining individuals (so they are not transmitting the virus within the network anymore), severing the links (by social distancing or by wearing personal protective equipment), isolating or vaccinating healthy individuals (so they do not belong to the infectious network anymore and are thus protected).

Observational studies typically involve actual observations, questionnaires and/or past medical records. They are useful to generate hypotheses or to reach provisional conclusions that sometimes lead to clinical trials.

It is a process followed by reputable scientific journals before formally publishing results of a scientific study. A group of independent scientists who were not involved in the work check the article that presents the results. They help to check that the methods, data, and conclusions are sound, and editors may request changes based on their feedback. This peer-review process helps ensure validity and accuracy. However, it can mean that some findings are not made public for quite a long time (weeks or months, sometimes even years).

A preprint is a public draft of a scientific paper before it gets peer-reviewed. Preprints are usually meant to allow rapid communication within the scientific community, to solicit feedback and to stake a claim on early findings. They are nowadays standard practice in many fields of research.

In the rush to make COVID-19 findings available quickly, the preprint practice has grown tremendously. Unfortunately, when mainstream media directly report such claims as established findings, it often adds confusion. In this context, some scientists think this practice could lead to dangerously false or misleading information being spread among the public and policymakers.

Scientific research pursues objective understanding of observable phenomena. To do so, scientists have developed an inquiring method through the last four centuries. This method aims at guaranteeing reliability, consensus on novel discoveries, and lack of bias and subjective opinions. In particular, the method is used to refute any dogmatism and stagnation on popular beliefs. In short, the scientific method works as follows:

  1. Make an observation, that is, observe a phenomenon through appropriate instruments.
  2. Ask a question. This can be driven by observed correlations among variables.
  3. Form a hypothesis, or testable explanation (“null hypothesis”). This is a tentative statement about the relationship between two or more variables, to be confirmed.
  4. Make a prediction based on the hypothesis: what will likely be observed in a controlled experiment?
  5. Test the prediction, with controlled and repeatable experiments. 
  6. Iterate: use the results to confirm the hypothesis, or to make new hypotheses or predictions and update the bulk of knowledge around that phenomenon.

In general, a scientific mindset suggests to critically analyse any claim, and to be ready to discuss previous beliefs in light of new evidence. Hence, researchers have also developed standardised ways to estimate the “known unknowns” and associated uncertainties [see below]. Moreover, every piece of knowledge is not considered true in an absolute sense, but valid (or significant) until falsified by new contrasting evidences. Hence, results are associated with different degrees of confidence.

Statistical analyses do not give 100% sure answers because of the inherent uncertainty in data, be it due to too small sample sizes, incomplete data, or other types of approximations.

This is valid for both for confidence intervals and hypothesis tests, where one wishes to test a certain statement (the null hypothesis, see Scientific Method above). The uncertainty implies that tests are prone to errors. In particular, there can be:

False positive (falsely reject the null hypothesis): A conclusion that something is significant when in reality it is not. The strength of a test to avoid false positives is called specificity.

False negative (falsely fail to reject the null hypothesis): A conclusion that something is not significant when in reality it is. The strength of a test to avoid false negatives is called sensitivity.

For instance, a patient could be detected negative after a PCR test while the virus is present, due to a false negative relying on an insufficient viral load in the throat area.

No measure is perfect, neither mathematical estimations or predictions. The reasons are manifold: finite precision of measuring instruments, fluctuation of data due to uncontrolled factors, randomness, approximations and intrinsic characteristics of models, and so on. All those deviations from true values constitute uncertainties. There are mathematical methods to evaluate the magnitude of such uncertainties, often reported in confidence intervals. This way, researchers estimate not only what they know, but also what they know they couldn’t know. Probability and Statistics are the mathematical domains that allow quantifying the uncertainty.

Complex systems in particular are notoriously difficult to predict. Hence, all predictions are accompanied by an estimation of how uncertain that prediction is. Usually, uncertainties increase the further we get from current data. This is true for weather forecasts as well as epidemic predictions.

HEALTH-RELATED TOPICS

Suspension of small, fine and light particles (on the order of micrometers) in the air such as mist or smoke. They can be emitted by people when coughing, sneezing and even talking. Unlike heavier droplets, they can stay airborne for minutes or longer. It is hypothesised that the novel coronavirus is probably spreading and infecting people via aerosols, but full consensus is not yet reached.

Drugs that fight bacterial infections. They do not work on viruses.

Proteins generated by the immune system to fight off a threat. Antibodies are generated by our body after an infection or a vaccine and tend to be uniquely suited against a particular virus or microbe. Developing antibodies is essential for the immune system to be able to fight future threats. They are also called immunoglobulin, hence the acronym Ig.

Used to detect whether a person has antibodies against a particular disease. It indicates whether they have had that disease. Antibody tests are also called “serology tests” because they examine blood serum. Such tests are not used to determine if someone is currently infected. Current SARS-CoV-2 antibody tests are not 100% accurate.

For viruses, antigens are protein that are displayed on the viral surface. Antigens are recognised by the immune system through the action of antibodies. The faster the recognition, the quicker the immune response against the pathogen.

Antigen tests look for fragments of specific viral surface proteins. They are proposed to be a faster way to diagnose COVID-19 than PCR tests. However, scientists are so far having difficulties finding a protein target unique to the novel Coronavirus and not affecting any other body entity.

Apps are software devices installed on smartphones. Their scopes are manifold, ranging from ludic to medical aid. Many apps have been developed for the fight against COVID-19, for example to book a priority slot at the supermarket or to keep “health diaries”. Other apps put patients and doctors in contact without physical meetings. Another kind of apps are designed to collect epidemiological data.

Finally, some apps are being developed for contact or proximity tracing, that is, logging which people a person gets close to (from 2 to 10 meters) and linking these contacts to test results in an anonymised manner. In case a person is tested positive, these apps can then send an alert to all the people this carrier has been in close contact with. They mostly work on Bluetooth technology and are designed to keep privacy violation to a minimum. Many researchers have recommended that contact tracing is essential to flatten the curve while reviving social life. Such apps are expected to help, especially because they can help to notify potential pre-symptomatic infected people.

Drugs against a certain disease that have been proven to work, either in cancelling the symptoms or in fighting the causing factors. They must be carefully tested and must pass clinical trials to ensure efficacy, safety and minimal side effects. Such drugs are disease-specific and cannot be safely used to treat other diseases without further investigation. Few national and international agencies have the mandate to approve drugs.

It describes the simultaneous presence of two or more illnesses in a person. With COVID-19, comorbidities like obesity, hypertension and diabetes increase the risk of worse outcomes.

When people are infected by others within a community, and the source is not known (as opposed to having contracted a disease while traveling, or catching it from a family member at home).

Large (generally, on the order of mm), short-range respiratory particles produced by sneezing, coughing, or talking. They fall quite rapidly (less than a minute) over a distance of 2 meters. Originally, droplets were considered to be the main mode of transmission for the virus, while more recently aerosols have been considered as another likely mode of infection.

A baseline or stable amount of a disease present in a given population.

An increase of disease prevalence, typically sudden, beyond the endemic baseline. It is usually geographically restricted compared to a pandemic.

If enough people in a population become immune to a disease, either by surviving it or through vaccines, they indirectly protect others by slowing down or stopping the spread. For COVID-19, it is estimated that between 70% and 90% of the population should be immune for herd immunity to be effective. Without a vaccine, natural herd immunity would require an unimaginable death toll.

Protection from a disease developed after contracting it or after receiving a vaccination against it. Being immune means that new exposures to the same virus do not lead to a new infection. Immunity is generated as the immune system creates antibodies.

Immunity can exist in varying degrees of robustness and for varying lengths of time, depending on the person, the severity of the first experience with a disease, the particular disease and the potential for the disease-causing agent to mutate.

The level of immunity an individual can develop against COVID-19 is still unknown, given that the disease has been around for only a short time. Inferring from knowledge on other coronaviruses, it has been estimated that COVID-19 immunity could last from months to a few years.

Any disease that can spread directly or indirectly from person to person via bacteria, viruses, parasites or other microorganisms that are pathogenic, which means “capable of producing disease”. All infectious diseases can be classified according to contagiousness and virulence.

Rapid rise of an epidemic [see above].

A pandemic is an epidemic that has spread over a large area. It means the disease is prevalent throughout several continents, or the whole world, affecting a large number of people simultaneously. Currently, we are seeing a worldwide spread of the novel coronavirus disease.

Biological tests that analyse genetic material taken from samples, e.g. throat swabs. These samples are run through a technical process called polymerase chain reaction (PCR). The test identifies the current presence of  specific genetic material, in this case that of SARS-CoV-2 virus. It differs from antibody tests that look whether a person has been infected previously.

Initially PCR tests took several days, then many companies developed rapid protocols to get results in a few hours. PCR tests generally have low rates of false results. However, they are only effective if a certain viral load has been accumulated in the host and the sampling was conducted by trained professionals. For COVID-19, the detectable viral load occurs normally after 3-4 days. So, people tested a few hours after contact could still be negative even though they are incubating the virus.

Face masks, eye protection, gowns, gloves and other gear used to protect against contagious diseases, especially in healthcare settings. It is agreed that they are useful against COVID-19. However, it is not yet fully assessed to what extent they are useful.

In epidemiology, it is the proportion of a particular population found to be affected by a disease at a specific time.

The method used to determine a DNA or RNA sequence of a pathogen. It can be applied in order to trace back the regional origin of the outbreak.

A product developed to stimulate the immune system to generate antibodies and therefore some level of immunity to a specific disease, without actually making the person sick. The process of developing a vaccine is highly controlled, and a candidate vaccine must undergo clinical trials [see p.9] before getting the approval. Currently, many candidate vaccines for COVID-19 are being developed and tested, but it is not known whether and when a mass-produced vaccine will be available, how well it will protect against COVID-19 and how long protection will last. Vaccine research could also be slowed down by mutations.

Unlike drugs, that treat an ongoing illness, vaccines aim at preventing it. Vaccination campaigns aim at protecting the population from contracting an infectious disease, in order to reduce the infection fatality rate.

A device that pumps oxygen-rich air into the lungs of a patient who is struggling to breathe on his own. There are many kinds of ventilator, from manually pumped bags to computerised devices.

A virus is a sub-microscopic infectious agent that replicates only inside the living cells of a host organism. Outside of a host, a virus either waits or decays. Once inside a host, it hijacks the cell’s reproductive machines, reproduces and either weakens or destroys the cell. During the reproduction phase, a virus might mutate. There are many viral families against which vaccines are more or less difficult to obtain.

The number of viral particles that get inside a person. Whether a person gets the disease or not might depend on the dose that is increased by contact and time of exposure. It is still not known what the minimum dose for COVID-19 is.

The amount of virus found in a defined volume of a test sample from a person.

It describes how aggressive, harmful and pathogenic a biological agent is. A pathogen is particularly virulent when it adheres easily to cells, can penetrate them, multiply rapidly and thereby destroy the tissue permanently. In order to classify pathogens, both contagiousness and virulence need to be analysed.

About the authors

Daniele Proverbio, M.Sc., is a doctoral student in the Systems Control Group at the Luxembourg Center for Systems Biomedicine (LCSB) at the Universität Luxemburg and visiting doctoral fellow at University of Exeter. He graduated in Physics of Complex Systems at the University of Turin and holds a Higher Education Diploma by the multidisciplinary excellence school Scuola di Studi Superiori di Torino „Ferdinando Rossi“.

Christophe Ley has been Professor of Mathematical Statistics in the Department of Applied Mathematics, Computer Science and Statistics at the University of Ghent since 2015. The Luxembourger completed his doctoral thesis in mathematical statistics at the Université libre de Bruxelles in 2010 and is currently Vice-President of ECAS, the European organization for advanced statistics courses, Vice-President of the Luxembourg Statistics Association, and founder of the international network S-TRAINING , which aims to use statistics and artificial intelligence in sports medicine and sports analysis.

Pierre Mangers has a degree in chemical engineering from the University of Karlsruhe (Karlsruhe Institute of Technology) specializing in applied mathematics and statistics. He also holds an MBA from Henley Management College in the UK (Henley Business School). After years of working at Arbed / Arcelor in various positions (production, strategy, Arcelor University), he moved to the consulting firm A.T. Kearny, where he then continued his career at PwC and EY as a partner. In 2018, he founded his own management consultancy MANGHINI Consulting, which supports organizations with strategic and operational issues.

Complete glossary for download as a PDF.

Authors: Daniele Proverbio, Christophe Ley, Pierre Mangers
Editors: Lucie Debroux (LCSB), Michèle Weber (FNR), scienceRELATIONS

Find the German and French version of the glossary here:

Aussi intéréssant

Studienteilnehmer gesucht Post-virale Fatigue: Post-Covid und Chronisches Erschöpfungssyndrom

Waren Sie an Covid-19 erkrankt und haben sich immer noch nicht erholt? Leiden Sie unter chronischer Müdigkeit? Dann ist ...

État des lieux scientifique Covid long : Que savons-nous – de plus?

Face à la recrudescence automnale de la pandémie, le sujet du covid long s’impose à nouveau. Quelles sont les dernières ...

FNR

Aussi dans cette rubrique

SCIENCE CHECK Ziel mir keng : Utilité et perspectives de l'hydrogène 

Pour pouvoir se passer du gaz, pétrole et charbon, il faut des alternatives. L'hydrogène a des avantages, mais aussi des inconvénients. Où est-il vraiment nécessaire ? Et où l'est-il moins ?

FNR
Décarbonation Protection du climat : quelles fonctions peut remplir l'hydrogène et quelles sont ses limites ?

L'hydrogène doit résoudre les enjeux de la transition énergétique et la décarbonation, éviter les sécheresses énergétiques et fournir du carburant propre aux avions. Peut-il tenir ces promesses ?

ÉTAT DES LIEUX SCIENTIFIQUE Les inégalités sont-elles en augmentation au Luxembourg ?

Les inégalités de fortune sont bien plus prononcées que celles de revenu en Europe. Ces dernières sont restées relativement stables ces vingt dernières années. Quelle est la situation au Luxembourg ?